Find out what information is available to you in a report.
Table of content
Wimi reports give you a set of performance indicators on your tasks.
- Click on the Report module of the concerned workspace to access the statistics.
- Click on All lists to select the task lists to be taken into account in the statistics (located on the far right of your screen).
Color matching on your Wimi reports
- Gray: task not started.
- Blue: task in progress.
- Orange: task completed.
- Red: task refused.
- Green: task validated.
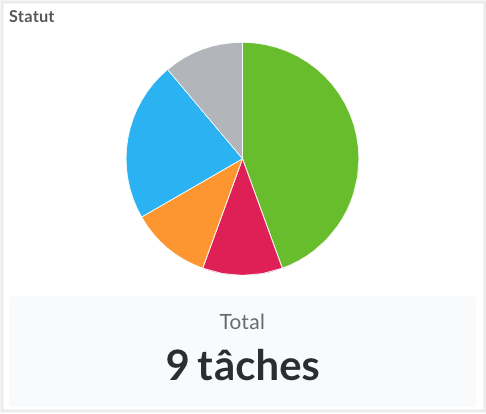
Reports - Tasks
This section shows the status, status, and number of hours spent on your tasks. The more detailed and detailed your tasks, the more precise the Wimi reports will be.
- Status of your tasks: not started, in progress, Completed, Validated, Refused.
- Display of the number of hours for carrying out the tasks.
- Percentage display of the ratio of hours or tasks according to your choice.
Burndown
This section provides statistics on your weekly and monthly tasks. It gives you a visual diagram of the status of your tasks.
- Click on the sorting option "Tasks" or "Hours" then on "Week" or "Month":
- Combine the 6 options according to your needs.
Performance
This section shows the average number of tasks performed per day.
- Click on the sorting option "Tasks" or "Hours" then on "Week" or "Month":
- Combine the 6 options according to your needs.
Tags
This section shows the status of tasks that use your tags. The diagram shows the number of tasks and their associated tags.